Relevant Skills
Point Cloud Data
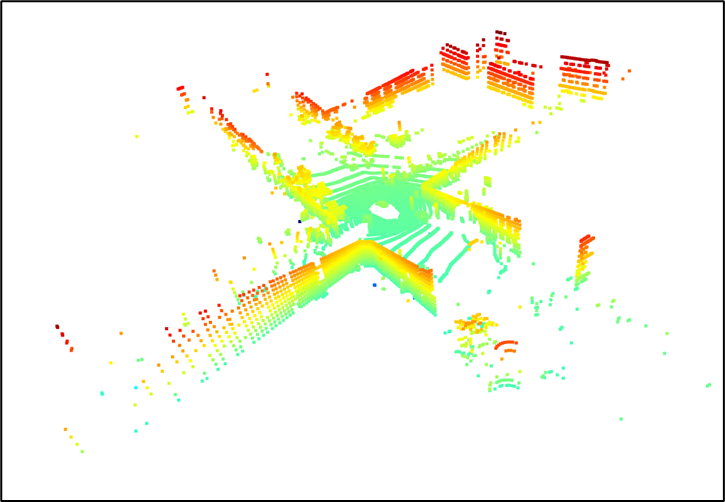
- Visualize Lidar point cloud data
- Visualize Radar data
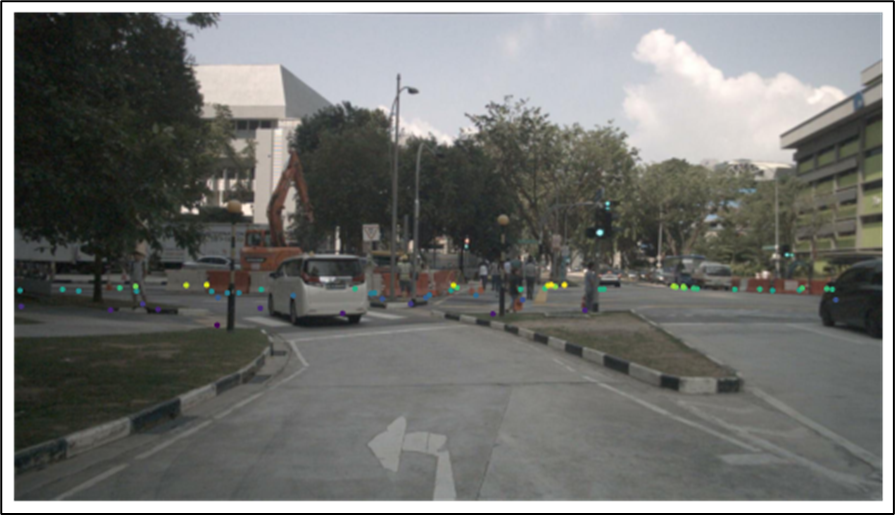
- Visualize Radar data projection on image
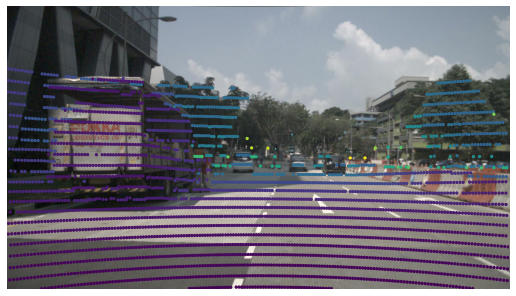
- Visualize LiDAR data projection on image
- NuScene develop kit
- Open3D
Sampling, 2D Convolution, Line Detection, Polygon Space Detection
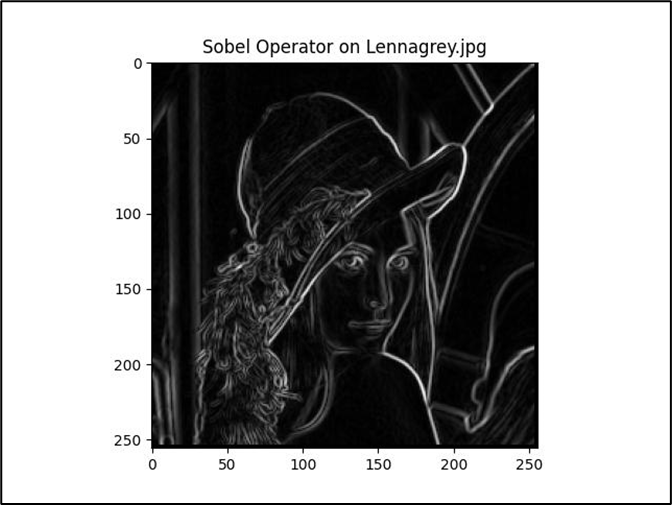
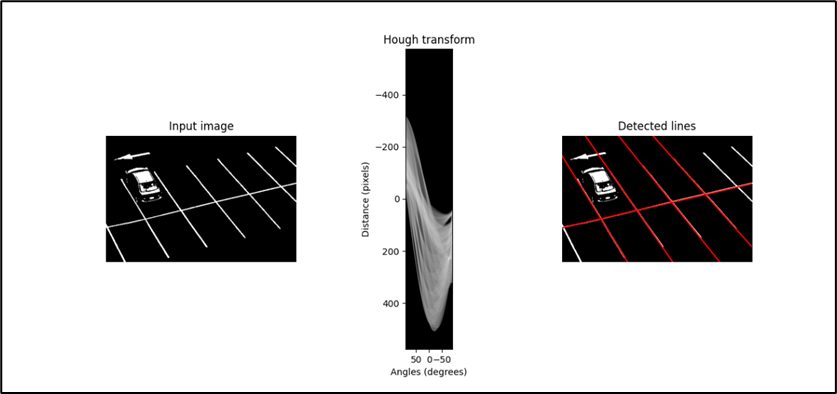
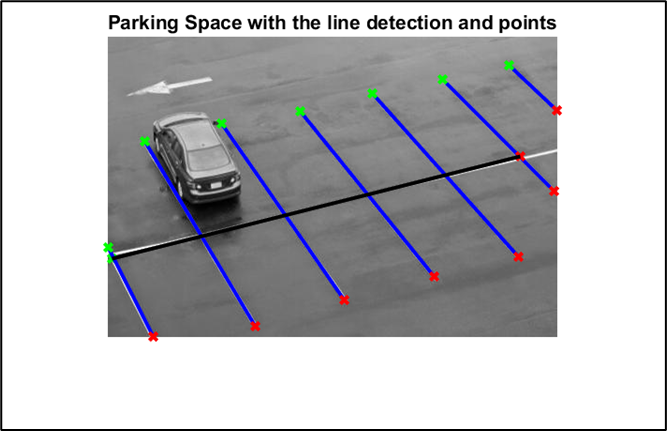
- The Lenna image was used to perform the Downsampling, RGB to gray conversion, 2D convolution, Sobel Gradient tasks were performed. An image of the parking lot was used for the line detection task. Hough line transformation was used for this purpose. The parking space polygons were plotted after performing line detection
Lidar Data Frame
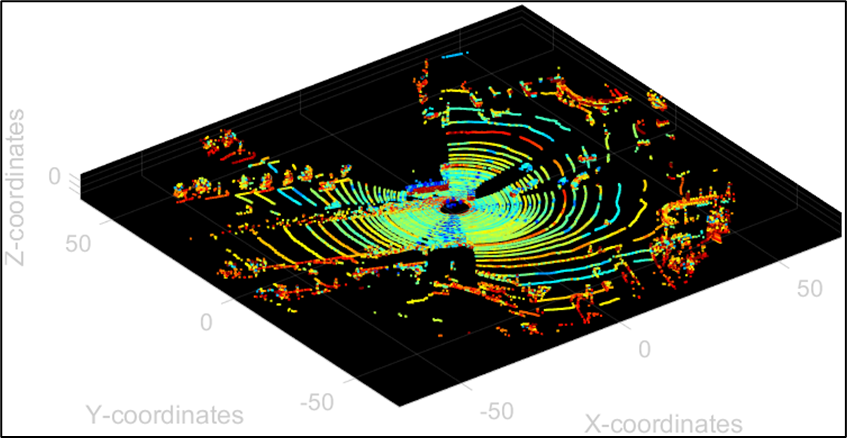
- Perform voxel filter (or box grid filter) to down-sample all the 3D point cloud points to the 3D voxel space points, and visualize the result points.
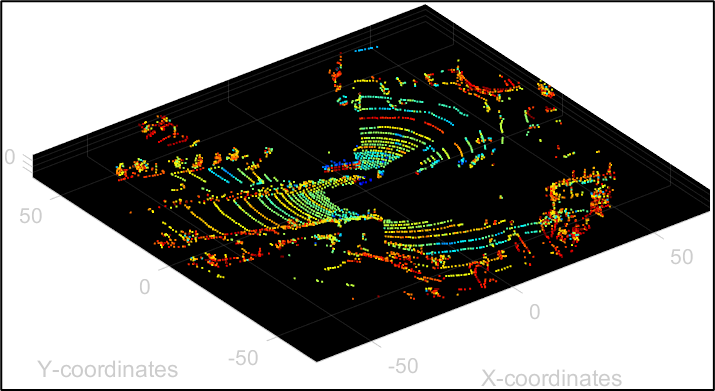
- Apply RANSAC algorithm (or any others you prefer) to the 3D voxel space points to find a ground plane model.
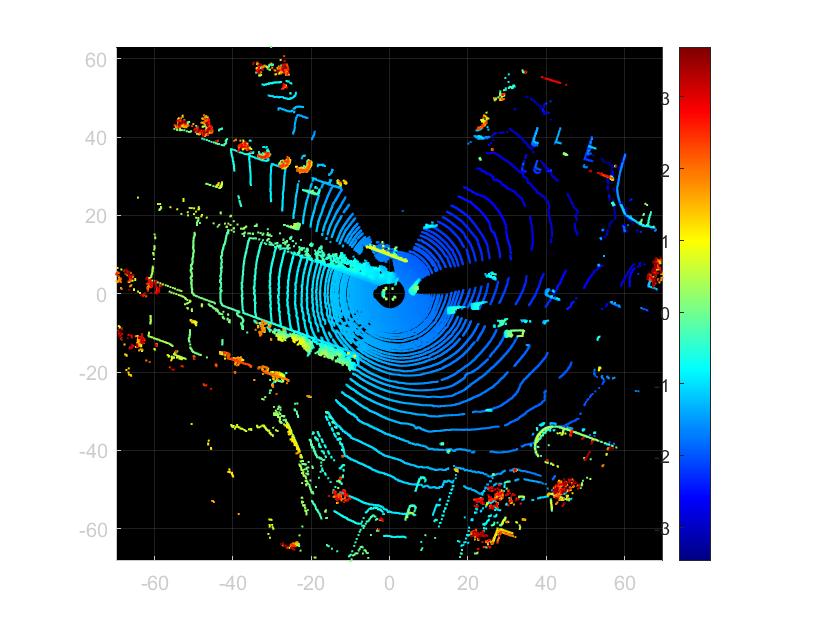
- Visualize all the off-ground points in the 3D
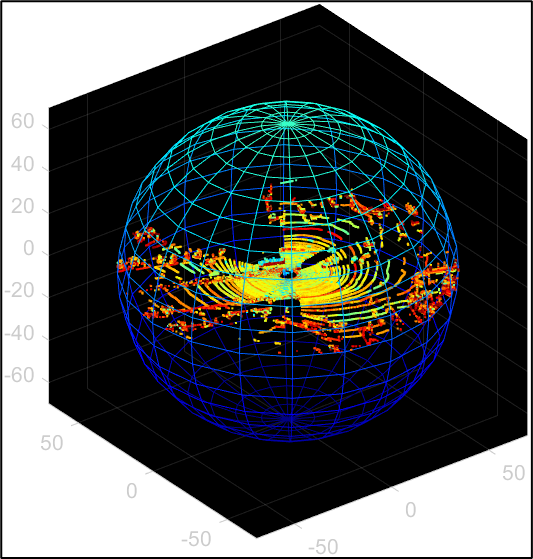
- Based on the raw point cloud data (Questions 1), which is in Cartesian Coordinate, represent and visualize all the point cloud in 3D of horizontal and vertical angels (converted using Polar Coordinate).
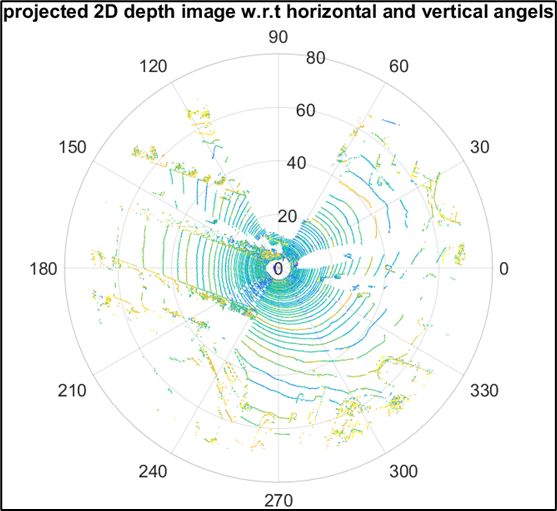
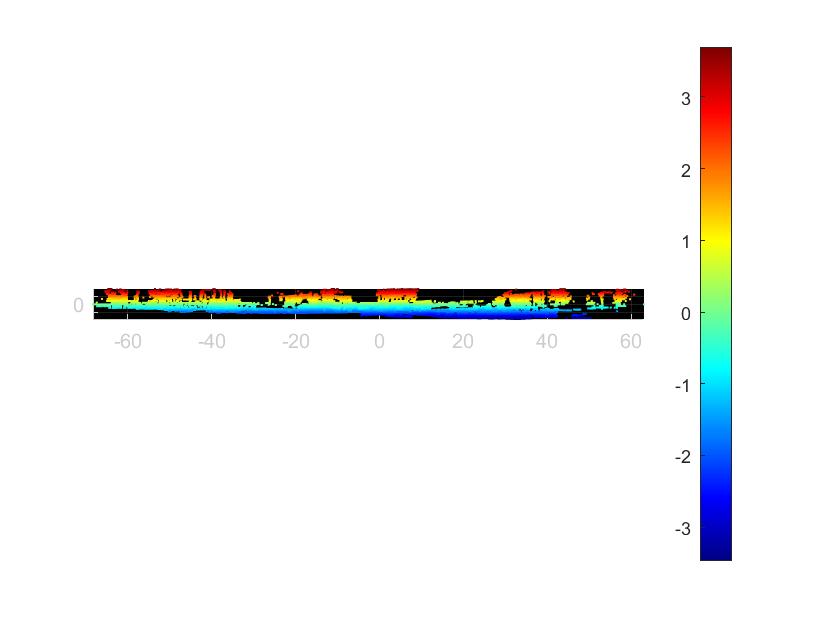
- Generate the projected 2D depth image w.r.t horizontal and vertical angels, with intensity value using the distance.
High Performnace Computing
- Parallel computation using PyCUDA
- Image Processing With PyCUDA
- Multithreading in Python
Robot Operating System and Turtlebot3
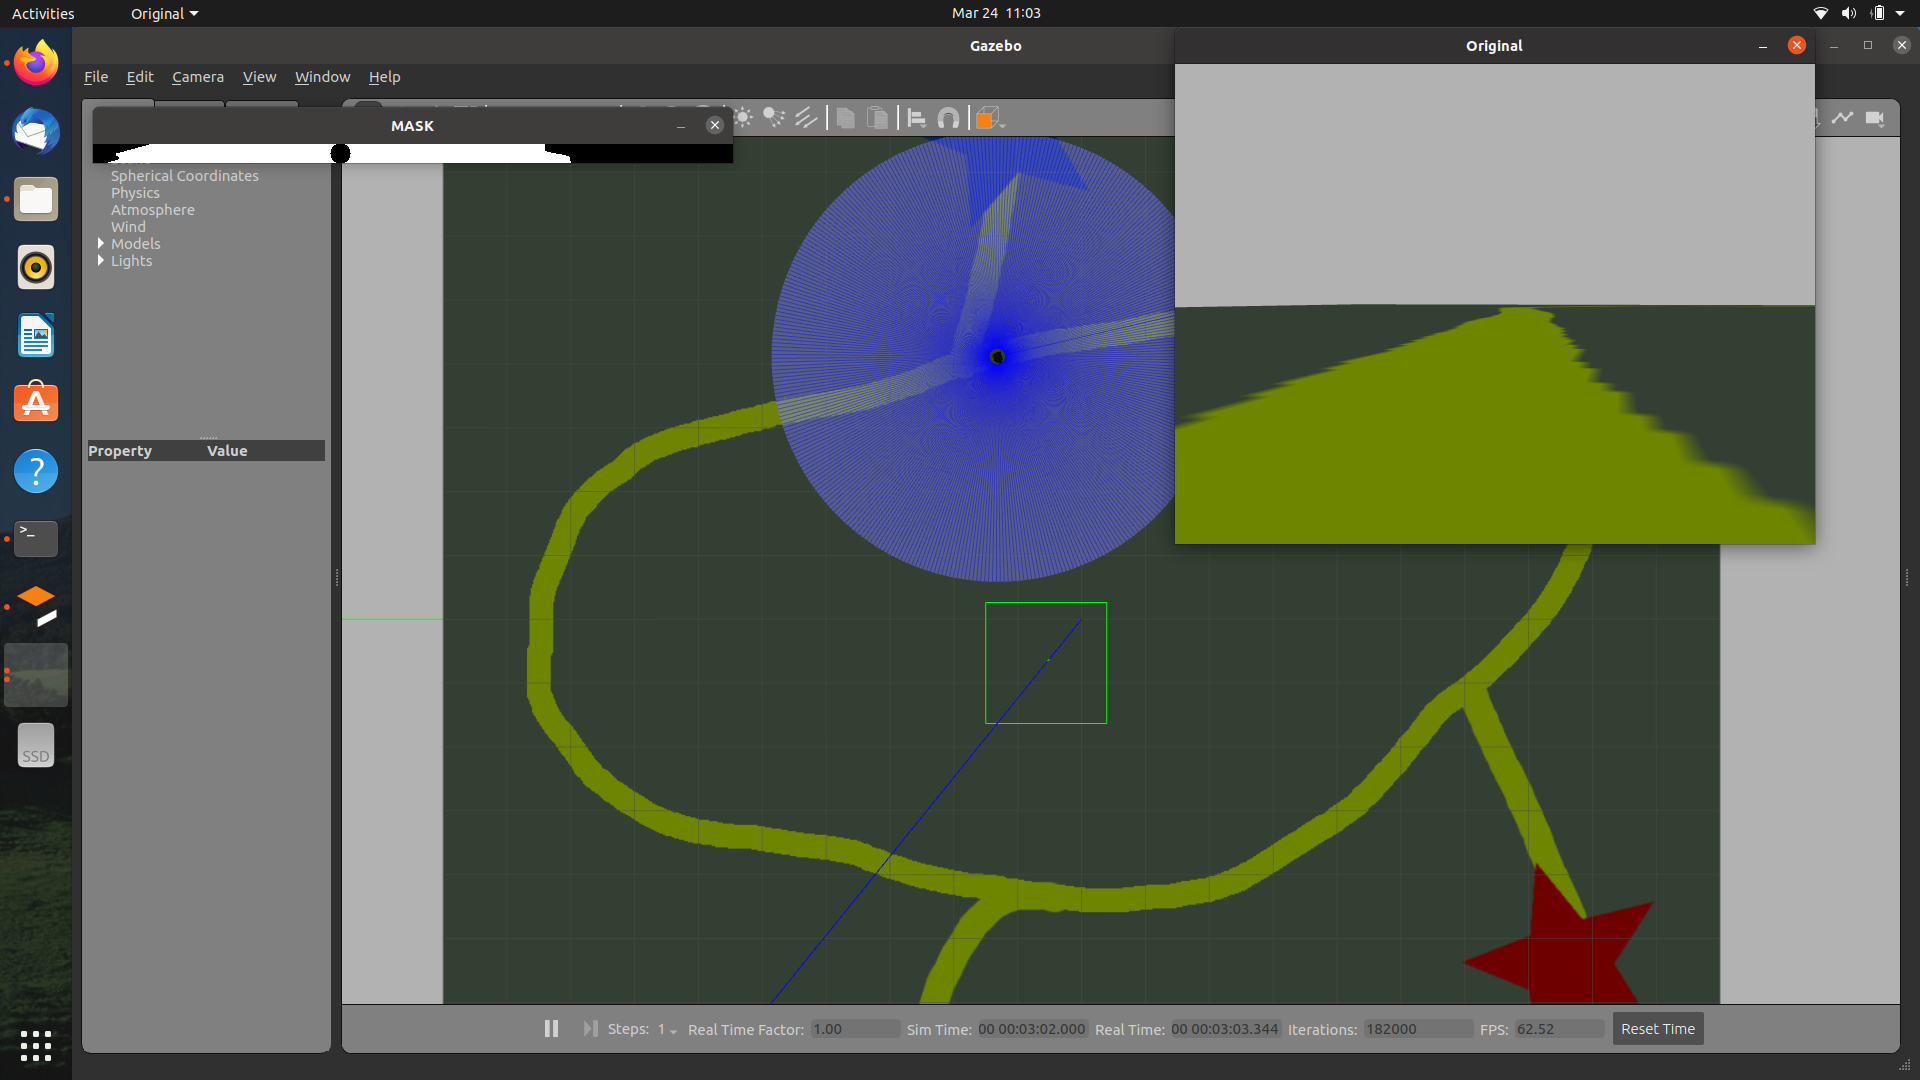
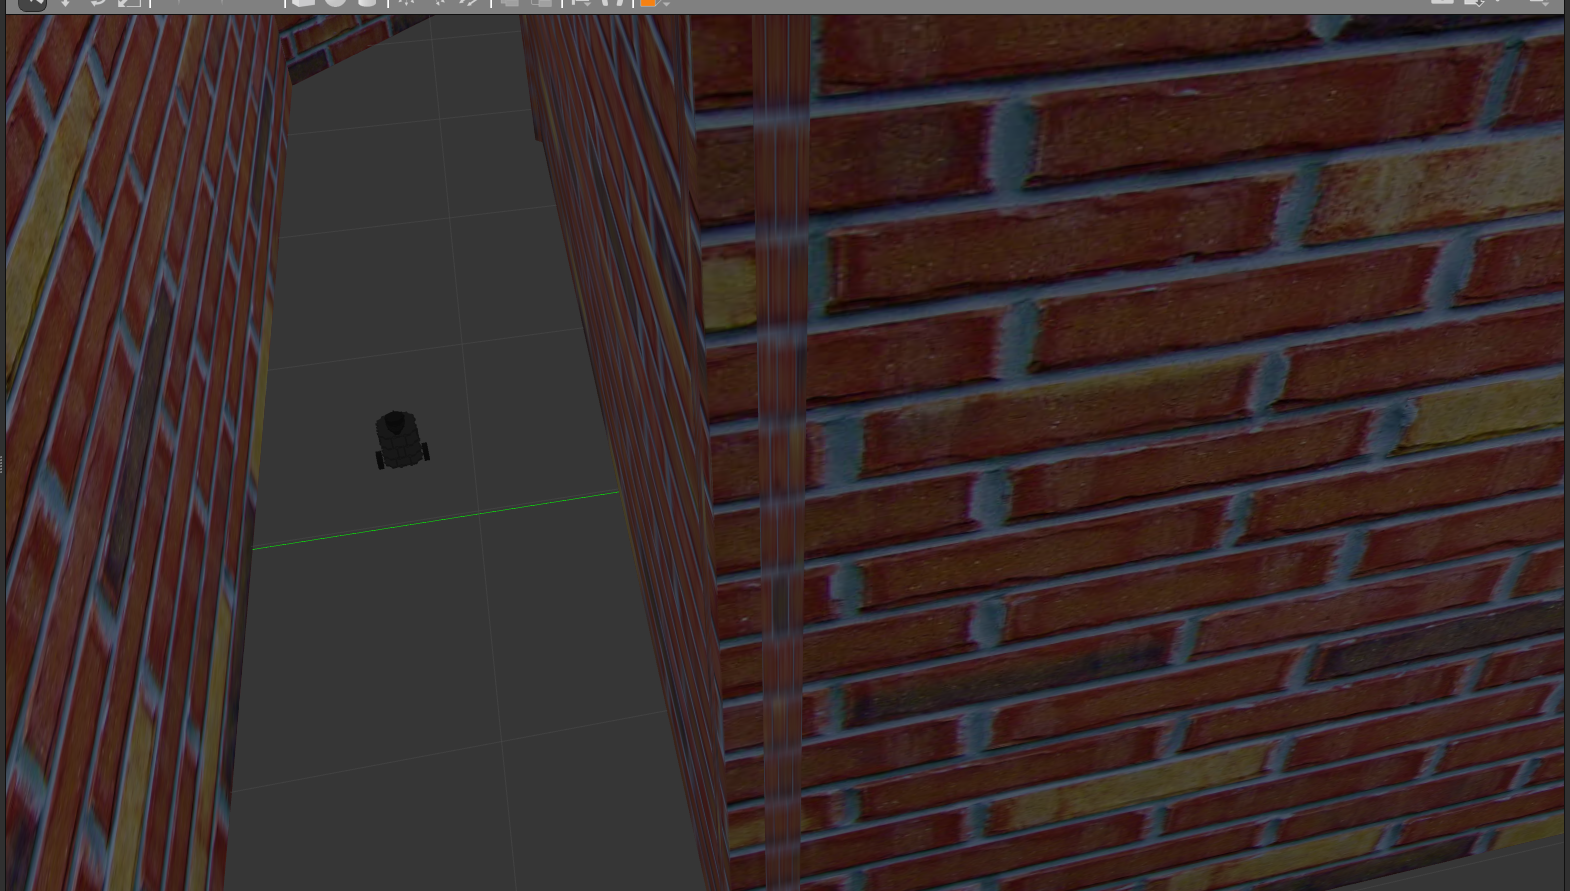
- Wall Following
- Obstacle Avoidance in Real and Simulation World
- Visualize all the off-ground points in the 3D
- Line Following and Apriltag Tracking
- Manipulating image data for tracking a point and mplementing path tracking controllers in Python
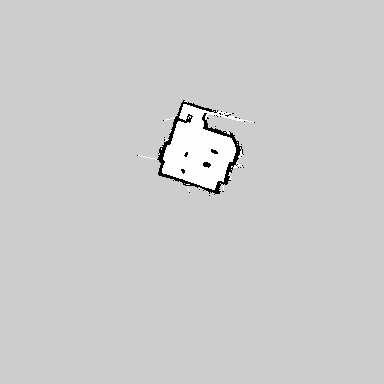
- SLAM and autonomous navigation in the saved map